

For the mode «Tracker»
Reports
The Reports section gathers clicks, conversions and money for a period in any grouping. Revenue counts approved conversions, and cost counts all clicks.
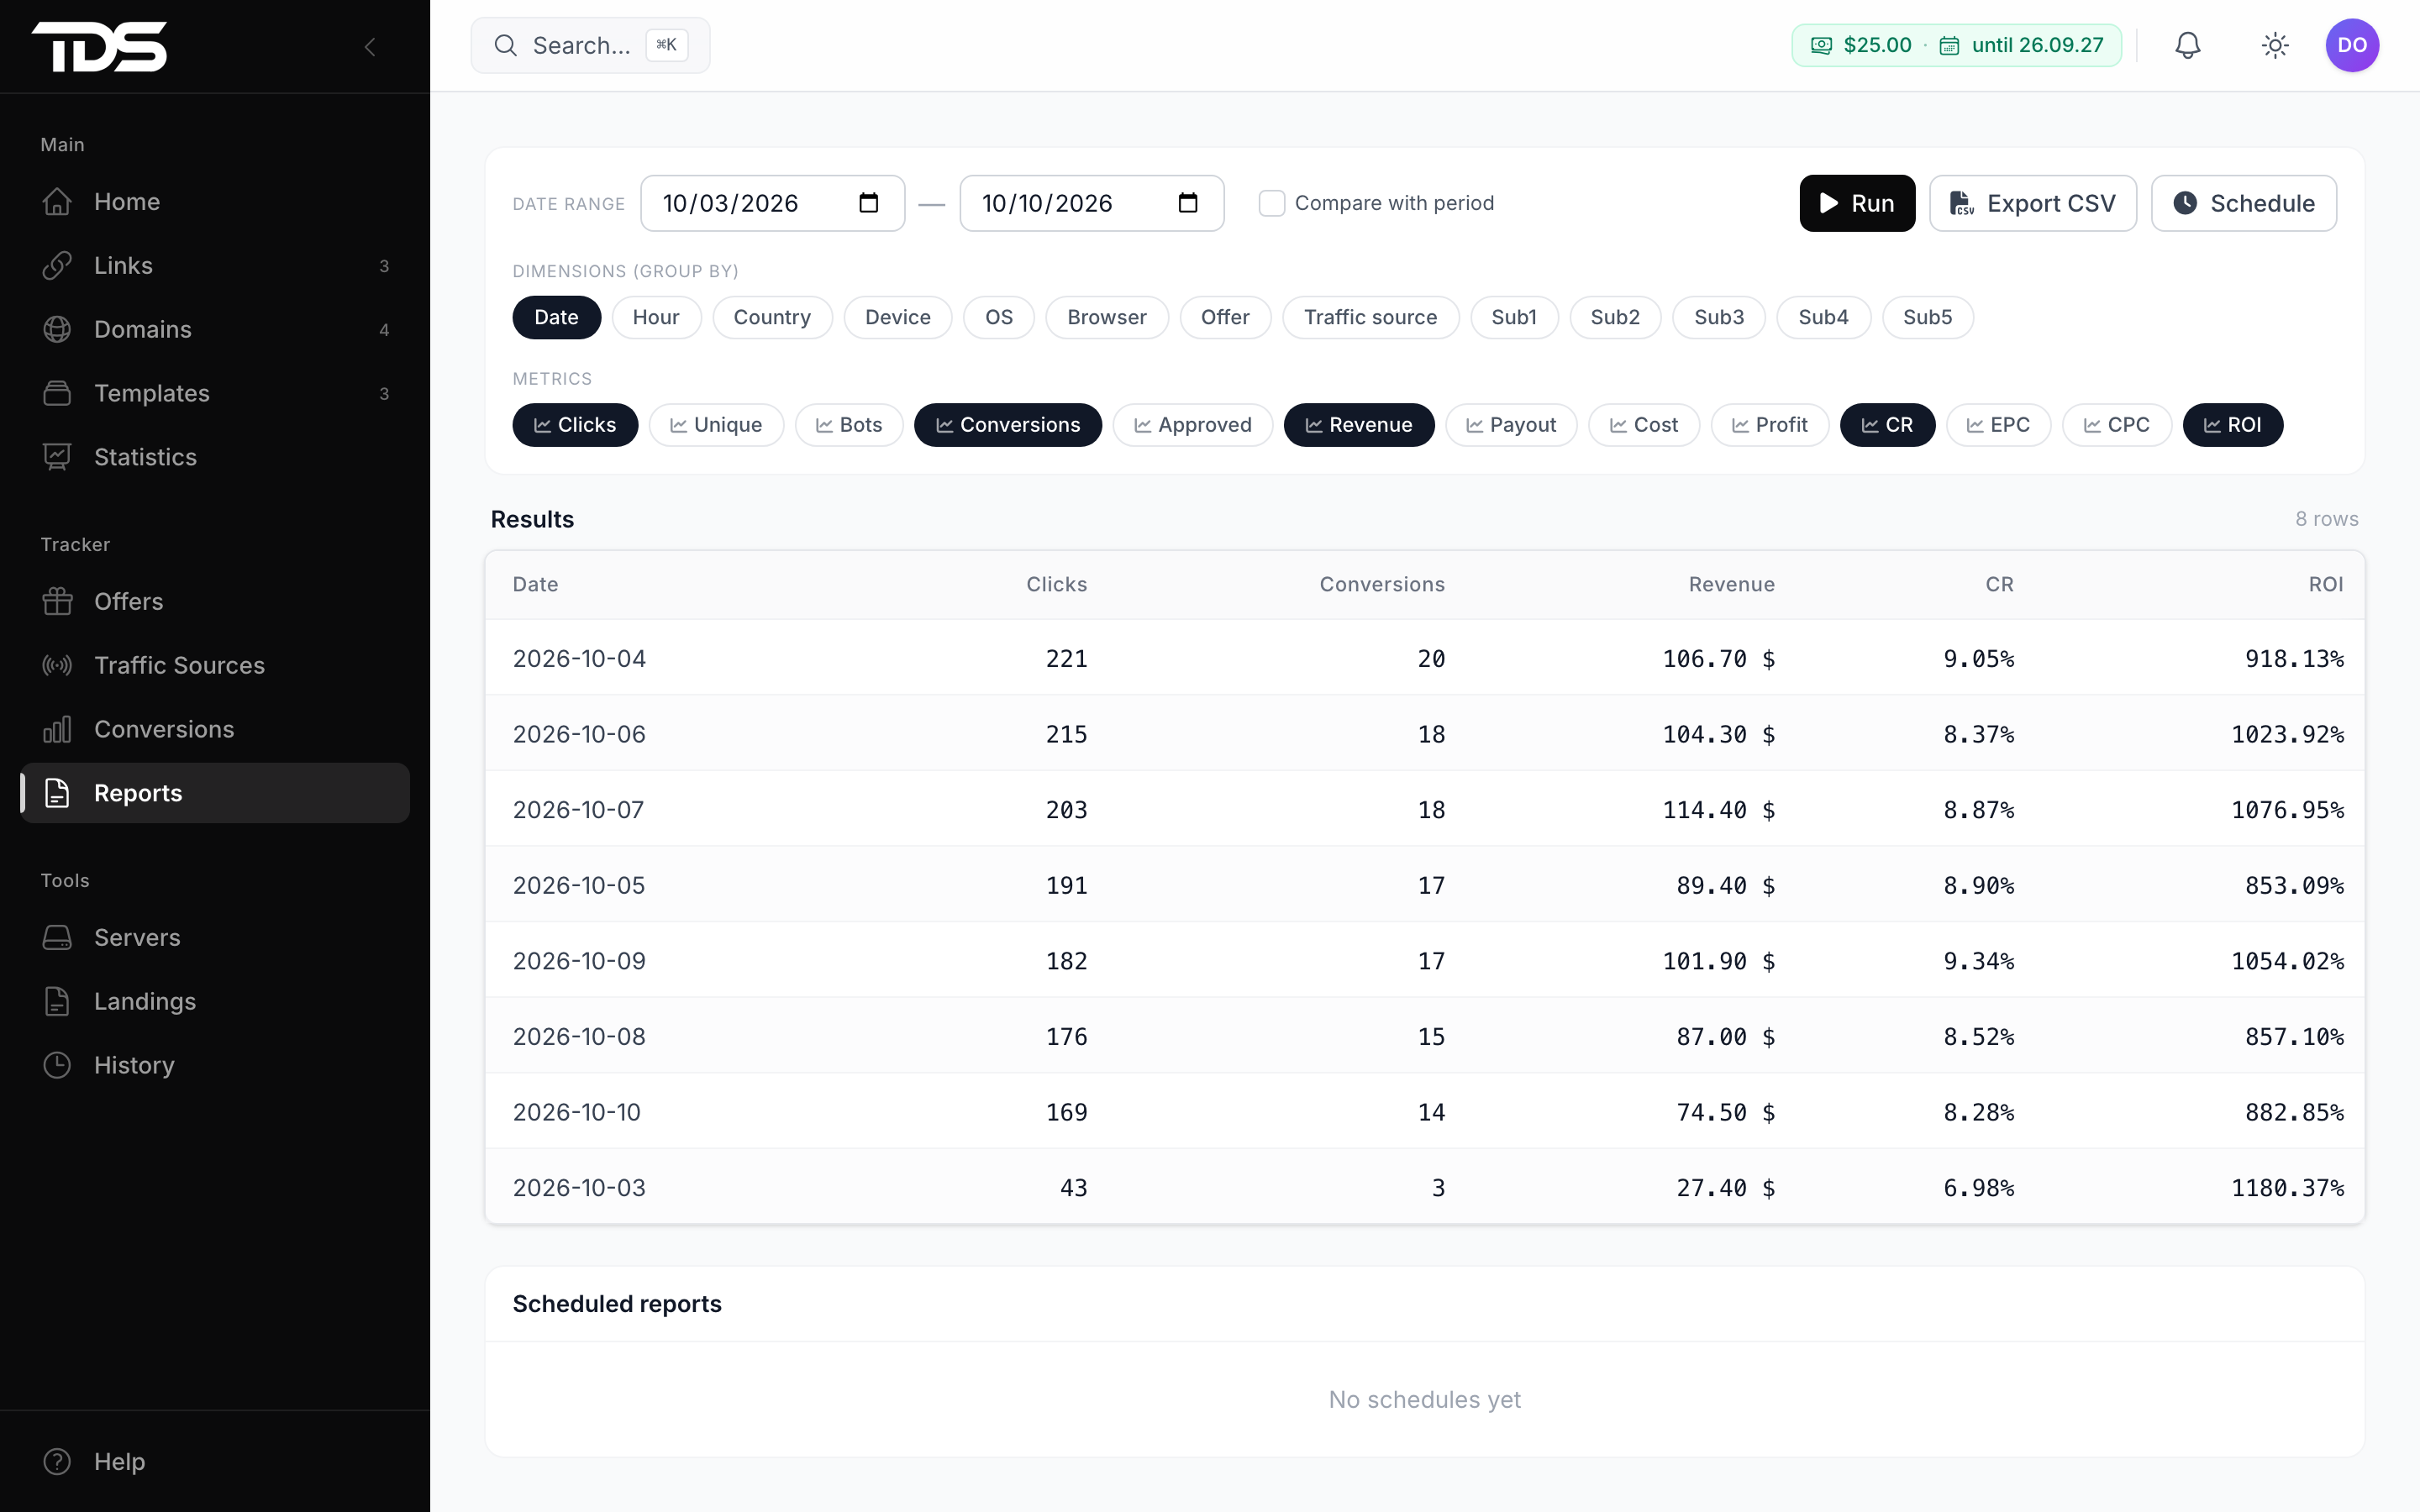
In Tracker → Reports you choose a period, groupings and metrics, and the table recalculates at once. There is no Build button.
How a report works
The chosen view is kept in the page address and in the browser, so it stays after a reload. By default it is grouped by Day with the metrics Clicks, Conversions, Registrations, Deposits, Reg2Dep, Revenue and ROI.
Period. Today, 7d, 30d, 90d or a custom period. The Compare with the previous period checkbox adds the previous period's value to each figure. You can pick another period to compare with.
Filters. By offer, by source and by campaign. Days follow the time zone from your profile settings.
Groupings. You can pick several, and they go in order.
| Grouping | What it is |
|---|---|
| Day, Hour | Click time. |
| Country | The visitor's country. |
| Device, OS, Browser | The visitor's device. They split clicks only: conversions and money go to the "—" row. |
| Offer, Source | The click's offer and traffic source. |
| Campaign address | The campaign address on your domain. In Links mode this grouping is called Link. |
| Sub1–Sub5 | Tags the source passed in the URL. Where each one goes: Traffic sources. |
Metrics. They are grouped into Traffic, Funnel, Money and Other.
| Metric | How it is calculated |
|---|---|
| Clicks | All clicks in the period, bots and repeat clicks included. |
| Unique | Clicks the redirector marked as unique. |
| Bots | Clicks where a bot was detected. |
| Conversions | All conversions received by postback, in any status. |
| Approved | Conversions with the approved status. |
| Registrations | Clicks that led to a registration, rejected ones excluded. Each click counts once. |
| Deposits | Clicks that led to a first deposit, rejected ones excluded. Repeat deposits are not included. |
| Reg2Dep | Deposits ÷ registrations. |
| Revenue | The sum of payouts of approved conversions. |
| Payout | Payouts across all conversions, in any status. |
| Cost | The price of all clicks in the period, bots included. Where the price comes from: Traffic sources. |
| Profit | Revenue minus cost. |
| CR | Conversions ÷ clicks × 100%. |
| EPC | Revenue ÷ clicks. |
| CPC | Cost ÷ clicks. |
| ROI | (Revenue − cost) ÷ cost × 100%. |
If the divisor is zero, the cell shows a dash. For ROI this happens when cost is zero.
Money is always in US dollars: the tracker has one currency for the whole account.
Table. It shows at most 5,000 rows. If there are more, a note above says only the first 5,000 are shown. Pages of 25, 50 or 100 rows, sorting by columns, and a Total row at the bottom. Clicking an offer or source cell opens the report for that value.
Export and schedule. The Export CSV button downloads the same table with the same period, groupings and metrics. The Schedule button sets up emailing of the report: a name, recipients, cadence (Daily, Weekly, Monthly) and the period covered (last 24 hours, yesterday, 7 days, 30 days, last month). The email goes out after midnight in the profile time zone. A schedule can be paused, and the Show in the report button brings its settings back onto the page.
Where conversions in a report come from: Conversions and postbacks. The same formulas are used in the campaign list and in Conversions: Tracker.
Tracker on the home page
If the tracker is connected to your account, the home page has money blocks. They show in both account modes.

- Revenue Today, ROI today and Conversions today. Under each figure you see the change against yesterday and a small chart.
- Top Campaigns: the five links with the most revenue over 30 days. Each shows clicks, revenue and ROI. In Tracker mode rows are named after the campaign, and clicking a row opens its form. In Links mode a row is named by the link address and opens the link. The view-all button leads to Campaigns (to Reports in Links mode).

Revenue and cost on the home page use the same formulas as reports. There is one difference: when cost is zero and revenue is positive, the home page shows ROI as 100, while a report shows a dash.
Conversions and postbacks
The affiliate program reports a conversion with a request to your postback address that carries the click number. Build the address in Conversions → Receiving conversions → Affiliate network.
Servers
A server is your VPS running Caddy that carries your domains' traffic; you can have any number of servers, and HTTPS certificates are issued automatically.